
Your shopping cart is empty!
Principles of Fluorescence Emission and Fluorescence Analysis
Fluorescence emission occurs when a substance absorbs light at a specific wavelength and re-emits it at a longer wavelength. Fluorescence analysis leverages this property for sensitive detection and quantification of compounds in various fields, including biology and environmental science.
The basic principles of fluorescence
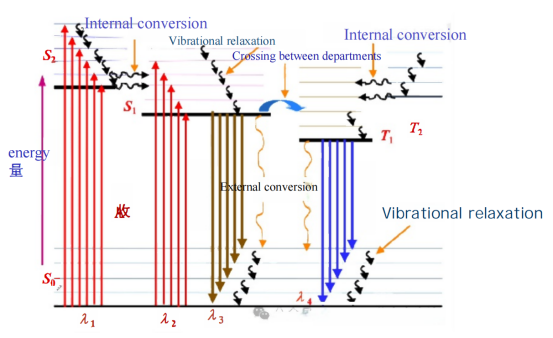
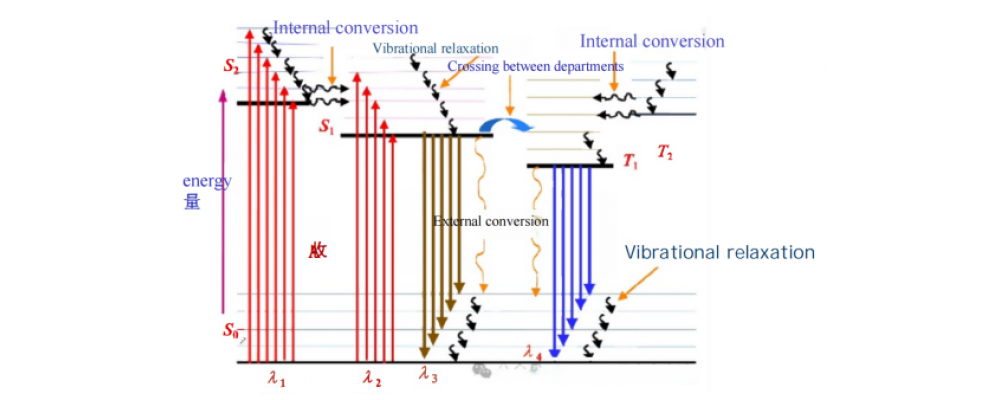
Fluorescence is a type of radiative transition, where radiation is emitted as a substance relaxes from an excited state to a lower energy state of the same multiplicity. From a microscopic perspective, when molecules are illuminated, they absorb photon energy, causing electrons within the molecules to transition from a lower energy level to a higher one. They then return to the ground state through radiative or non-radiative decay processes, emitting photons in the process, which produces fluorescence or phosphorescence. Fluorescence emission occurs simultaneously with radiation and quickly disappears when the radiation stops. In contrast, phosphorescence involves a delay from the time of radiation absorption to when the light intensity peaks, and the emission persists for a period after radiation ceases.
01 Fluorescence test method
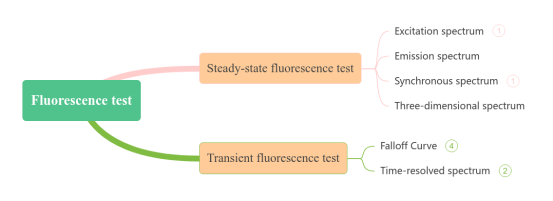
Fluorescence can be categorized into steady-state and transient fluorescence measurements in the time domain. Fluorescence spectroscopy is suitable for analyzing solid powders, crystals, films, and liquids. Depending on the sample type, quartz cuvettes (for liquids) or solid sample holders (for powders or films) are used. Based on steady-state and transient fluorescence, fluorescence spectral analysis can be coupled with microscopy to obtain micro-area analysis results and can adapt to various external experimental conditions to yield fluorescence spectra under different temperatures, pressures, and magnetic fields.
02 Two-dimensional fluorescence spectroscopy
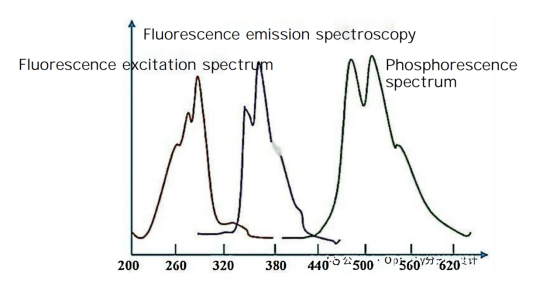
Two-dimensional fluorescence spectroscopy mainly includes fluorescence emission spectra and excitation spectra. The fluorescence emission spectrum is obtained by fixing the incident wavelength to excite the substance and detecting the distribution of fluorescence intensity with respect to emission wavelength. The excitation spectrum is measured by fixing the emission wavelength and detecting fluorescence intensity as a function of different incident wavelengths. Conventional fluorescence analysis techniques primarily perform qualitative and quantitative analysis of inorganic and organic compounds.
03 Synchronous fluorescence spectroscopy
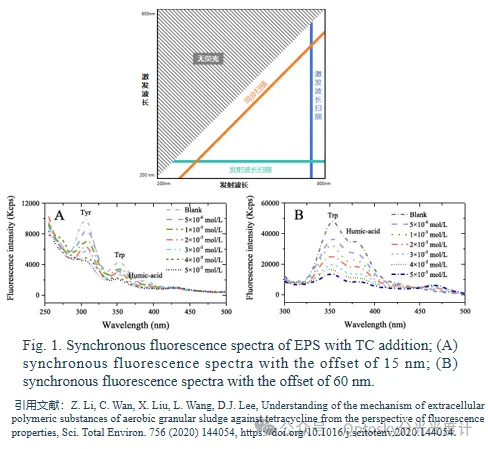
Synchrofluorescence analysis, first proposed by Lloyd, distinguishes itself by methods such as constant (fixed) wavelength, constant energy, variable angle, and constant matrix methods. It leverages the absorption and emission characteristics of compounds, improving the selectivity of spectral analysis. Synchrofluorescence spectroscopy enhances strong bands while minimizing interference from weak bands, effectively eliminating Rayleigh interference and broadening Raman intensity. This technique is well-suited for analyzing multi-component mixtures, finding widespread applications in environmental, pharmaceutical, clinical, and chemical industries.
04 Three-dimensional fluorescence spectrum
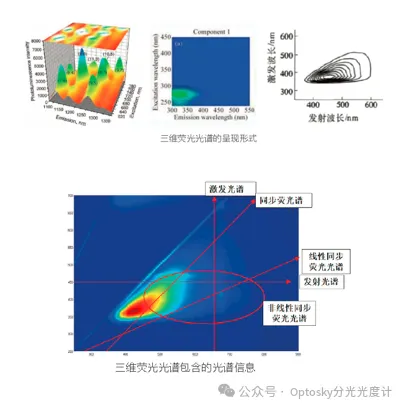
Three-dimensional fluorescence spectroscopy is a new technique developed in recent decades. Fluorescence intensity is actually a function of both excitation and emission wavelengths. A three-dimensional fluorescence spectrum describes the relationship between fluorescence intensity and these two variables, providing more comprehensive spectral information than conventional or synchrofluorescence spectroscopies. In a multi-component system's three-dimensional fluorescence spectrum, each component has a distinct absorption and emission spectral region, allowing for the detection of all components in a single scan. This technique serves as a spectral fingerprint method in environmental monitoring, clinical chemistry (distinguishing cancer from non-cancer cells based on fluorescent metabolic products), and bacterial identification, among other applications. It can also be used for monitoring photochemical reactions and qualitative and quantitative analysis of multi-component mixtures.
The fluorescence quantum yield (φf) is another fundamental parameter of fluorescent substances, indicating the ability of a substance to fluoresce, with values ranging from 0 to 1. The yield depends on the chemical structure of the substance and environmental factors (temperature, pH, solvent, etc.). Various methods exist for measuring the quantum yield, typically using a reference method. This involves comparing the integral fluorescence intensity of the test substance and a reference substance with a known quantum yield, both measured under identical excitation conditions. Fluorescence quantum yield measurements provide insights into the optical properties and chemical composition of substances, with applications in materials science, biological science, medicine, optical devices, and energy science.


Related Products

30.00″W x 40.00″D x 18.00″H
ATR3020
Search
Categories
Popular Posts


Latest Posts


Comments: 0
No comments